Home World University Rankings 2026

University of Wisconsin, Milwaukee
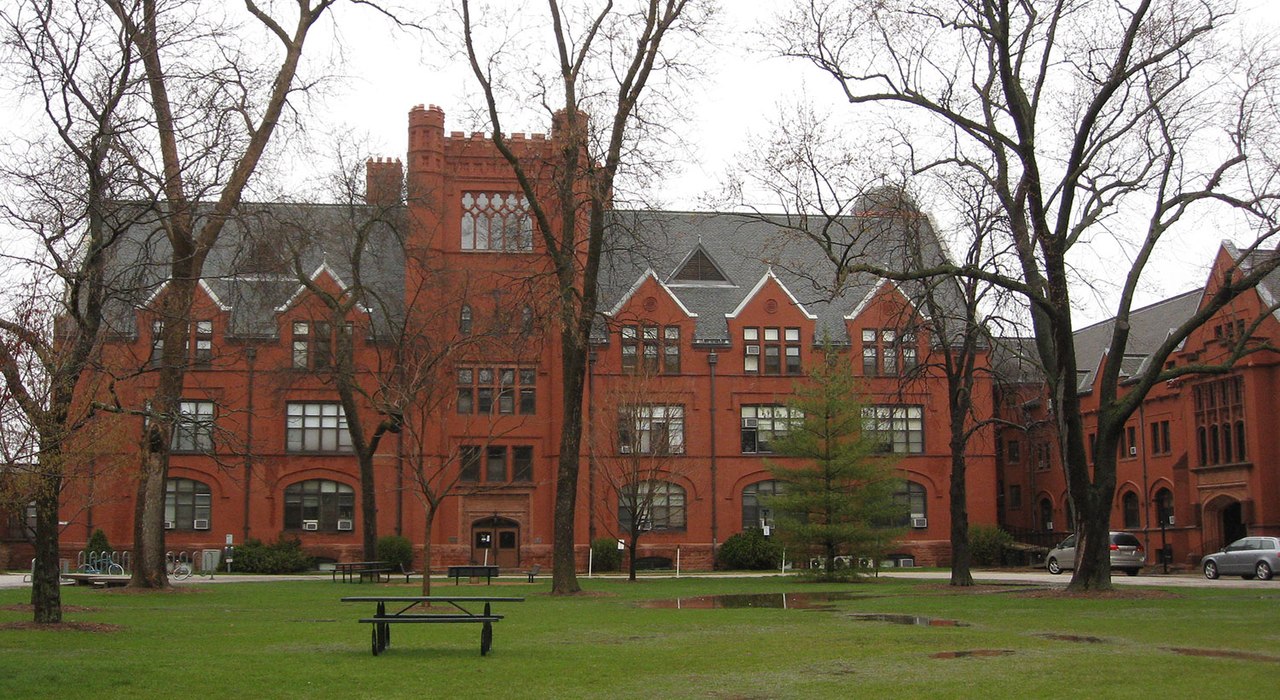
Photo: Freekee at English Wikipedia · Public domain · Wikimedia Commons
How it scores
Research and Alumni outcomes are percentiles among 2,287 universities; alumni outcomes are counted per student. Admissions & earnings is the position among universities in the same country (United States).
Admissions, outcomes and alumni
- Admit rate
- 90.7% src
- Average SAT
- 1,090 src
- Yield (admits who enrol)
- 23% src
- Median earnings 10 years after entry
- $54,990 src
- 40-year return on investment (Georgetown CEW)
- $1.84M src
- Graduation rate (6 years)
- 49% src
- Rhodes Scholars, 2021–26
- 0 src
- Internationally notable alumni (Wikidata)
- 8 src
- Heads of state or government (Wikidata)
- 2 src
- Founders, billionaires and $30M+ alumni
- not on the published top lists; estimated
- Students (undergraduate headcount / total FTE, IPEDS)
- 16,758 / 19,166 src
Each figure links to its source. Admissions and earnings figures are comparable only within a country.
Research Index
Percentiles among 1,305 ranked universities. Rank on quality alone: 711. On strength alone: 1086. The Research Index scores research only; admissions, earnings and alumni outcomes are scored in the overall ranking where data exists.
The numbers behind it (2020–2023)
- Papers in the top 10% of their field
- 8.6% (7.6%–9.7%)
- Papers in the top 1% of their field
- 1.2% (0.8%–1.6%)
- Top-10% papers (fractional count)
- 151
- All papers (fractional count)
- 1,747
- International co-authored
- 39.1%
- Open access
- 53.6%
- Papers from 2020–23 since retracted
- 2 (0.48 per 1,000)
Core publications, fractional counting, field-normalised citation shares. Brackets show Leiden’s stability interval. Collaboration and open-access shares use full counting and aren’t field-normalised. Retraction counts come from the Retraction Watch database and include publishers’ mass retractions as well as honest-error retractions; a retraction is not by itself evidence of misconduct, and the count is never scored.
By field
Position over time
The same method applied to each 4-year publication window. The number of ranked universities grows from period to period, so position is shown as a share of the field.
How other rankings place it
Other rankings are cited for comparison. The Research Index measures research only; QS and THE also use reputation surveys and figures universities submit, and ARWU counts prize winners and total output.
Prize winners
- Alumni laureates
- 1
- Staff laureates
- 0
Alumni: 1 Nobel. Most recent: Jack Kilby (Nobel Physics, 2000). Counted from Wikidata (CC0). Alumni laureates count toward the overall ranking per student (10 of 65 global weight points); staff laureates are shown for context only.