Home World University Rankings 2026

Deakin University
Logo: Deakin University · CC BY-SA 3.0 · Wikimedia Commons
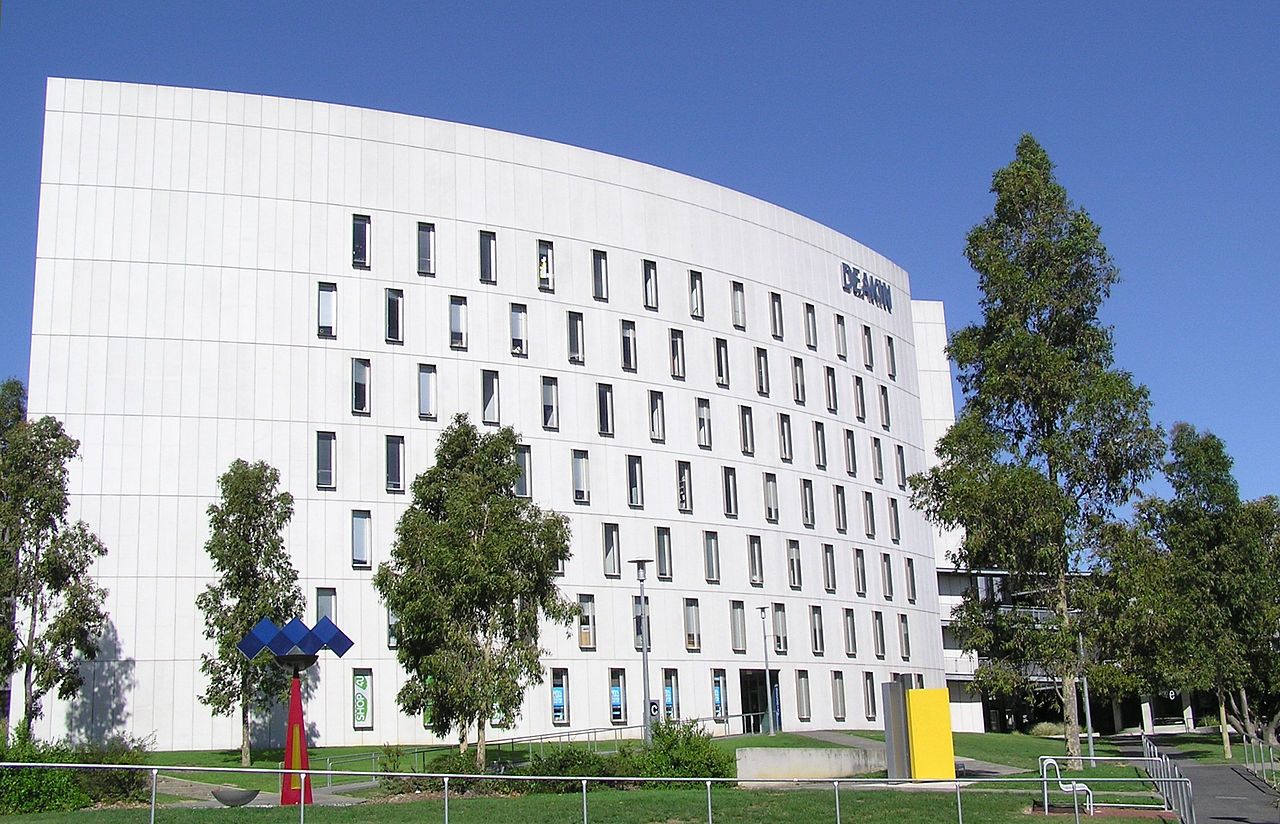
Photo: Donaldytong · Public domain · Wikimedia Commons
How it scores
Research and Alumni outcomes are percentiles among 2,287 universities; alumni outcomes are counted per student. Admissions & earnings is the position among universities in the same country (Australia).
Admissions, outcomes and alumni
- Median graduate salary (QILT)
- A$75,000 src
- Internationally notable alumni (Wikidata)
- 5 src
- Heads of state or government (Wikidata)
- 0 src
- Founders, billionaires and $30M+ alumni
- not on the published top lists; estimated
- Students (undergraduate / total)
- 37,242 / 58,835 src
Each figure links to its source. Admissions and earnings figures are comparable only within a country.
Research Index
Percentiles among 1,305 ranked universities. Rank on quality alone: =66. On strength alone: =183. The Research Index scores research only; admissions, earnings and alumni outcomes are scored in the overall ranking where data exists.
The numbers behind it (2020–2023)
- Papers in the top 10% of their field
- 14.8% (14.2%–15.5%)
- Papers in the top 1% of their field
- 1.8% (1.6%–2.1%)
- Top-10% papers (fractional count)
- 1,013
- All papers (fractional count)
- 6,829
- International co-authored
- 56.9%
- Open access
- 58.7%
- Papers from 2020–23 since retracted
- 8 (0.43 per 1,000)
Core publications, fractional counting, field-normalised citation shares. Brackets show Leiden’s stability interval. Collaboration and open-access shares use full counting and aren’t field-normalised. Retraction counts come from the Retraction Watch database and include publishers’ mass retractions as well as honest-error retractions; a retraction is not by itself evidence of misconduct, and the count is never scored.
By field
Position over time
The same method applied to each 4-year publication window. The number of ranked universities grows from period to period, so position is shown as a share of the field.
How other rankings place it
Other rankings are cited for comparison. The Research Index measures research only; QS and THE also use reputation surveys and figures universities submit, and ARWU counts prize winners and total output.
Prize winners
No Nobel, Fields, Turing or Abel laureates linked to this university in Wikidata.